
Intentions to visit continue to remain generally depressed – and relatively steady – across the United States.
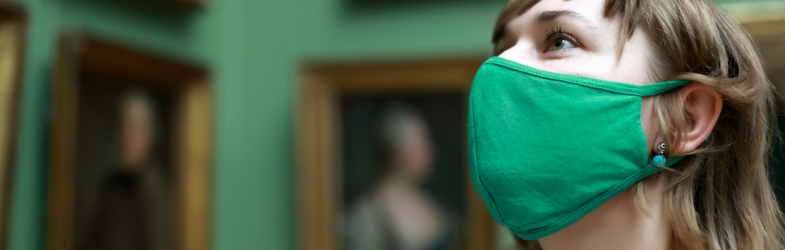
As coronavirus cases in the United States continue to rise, we’re predictably observing low intentions to visit cultural entities in the immediate near term, as well as indications of recovering intentions within three months. This pattern of dramatically depressed near-term intentions coupled with a hopeful view of a looming recovery has been consistent. In other words, throughout the pandemic, people have been essentially saying, “I’m planning to return to cultural organizations as usual soon… but not today.”
Future timeframes to visit may have the embedded assumption that the nation will have a better handle on the virus “in the next three months.” When the national emergency was declared on March 13th, people intended to resume usual visitation behaviors within six months. Naturally, plans to visit moved in closer during the nation’s stay-at-home orders. By May 16th, people in the United States intended to generally resume normal visitation patterns within three months. However, one-week and one-month intentions to visit still have not recovered enough for those plans that were being made in mid-May to be realized. Attendance recovery continues to roll back as people struggle to make sense of surges, safety practices, and social distancing.
In some areas, cultural organizations still aren’t open. In other areas, the virus is worse than ever. Perhaps most confounding of all is that there are areas where cultural entities are open and also the virus is worse than ever – creating hesitation and apprehension as people determine how best to coexist alongside the virus. Some people are even trying to figure this out amidst contradicting statements and directives from various government officials in their area.
I’ll lead with the not-so-bad news: People still generally intend to resume normal visitation patterns within the next three months – as they have since mid-May. The target seems to simply be moving backward as time goes on without a clear solution to containing the virus. People generally still plan to visit cultural organizations at usual levels within three months from now.
Some more not-so-bad news (for some organization types): Many entities in the US have limited capacity, and entities that allow for freedom of movement – and particularly those that are outdoors – are experiencing increased demand. This means that some cultural organizations are indeed performing decently amid lower national intentions to visit, as their capacity is capped to begin with and they have the benefit of being perceived as a safer leisure activity, all things considered.
But the fact remains: Three-month intentions to visit have been a rolling horizon thanks in large part to our country’s lack of a national policy for tackling the virus. For three-month intentions to visit to be realized, one-week and one-month intentions need to start a corresponding recovery. This is not happening yet.
Let’s take a look at the data this week:
Updated data on intent to visit cultural entities as of July 25th
Today we are providing a one-week update and sharing information collected through July 25, 2020. The research quantifies the US adult public’s intentions to visit 84 unique cultural organizations within the United States – from art museums and aquariums to theaters to symphonies. For the week ranging from July 18-25, the data and analysis summarized below represent an additional sample of 2,115 adults.
One’s intent to visit is among the best available metrics for reliably predicting behaviors and it historically correlates with actual attendance. It helps us understand people’s plans for future visitation at any given time, and further aligns these intentions to a specific chronology. This metric not only quantifies the strength of intentions to visit an organization but also identifies the duration within which one intends to manifest this intention. This metric contemplates plans to visit any kind of cultural entity – either exhibit-based or performance-based. This said, it’s worth noting that some organization types are experiencing greater demand than others during the pandemic.
A good way to think of these scalar values is as a measure of the relative certainty of an intended behavior being actualized. Thus, a value of “1” would indicate no intentions whatsoever to visit an organization, whereas a reported value of “100” would suggest that the respondent was essentially waiting in line for the doors to open.
Intentions to visit cultural organizations historically decrease slightly from the end of June to the end of July. This happens due to seasonality. Cultural organizations generally have the greatest volume of visitation in the summertime months. So, when we ask someone at the end of June when they plan to visit and they say within the next month or three months, they’re generally still talking about visits through the end of the summertime. By the end of July, three-month intentions to visit land squarely in the fall season, when fewer people generally visit cultural organizations.
This is what things look like during a non-pandemic year:
Now let’s take a look at 2020. We’ve been tracking this metric for 20 weeks now and it’s been getting busy and difficult to read. To that end, we’ve updated our 2020 charts to show the data for the end of each month (similar to the 2019 data), as well as the most recent data cut that takes place every Saturday.
Nationally, near-term intentions to visit are still notably depressed compared to last year, but three-month intentions match last year’s values.
One-week intentions to visit cultural organizations remain depressed. Intentions to visit cultural organizations within one week remained unchanged on a national level compared to last week, and are at levels last observed at the end of May.
One-month intentions lag behind 2019 values. One-month intentions to visit decrease slightly in July due to seasonality – even during a non-pandemic year. This said, there is a notable delta between the value of 15 that we see in one-month intentions to visit right now and the historical value of 17 that we historically see around this time.
Three-month intentions have nationally recovered to historic values. Considering the seasonal dip that typically happens in July, this value matches historic levels. It means that people generally intend to return to their more usual visitation patterns for this time of year within three months.
Remember that this is what people plan to do given the current condition. Of course, things may change to make these visits unable to take place. Still, if people are planning their visits, it’s important for cultural organizations to keep them engaged so that the attendance may be realized.
How might schools being online or in-person impact intentions to visit cultural entities?
We touched on this last week, and it’s worth mentioning again. Interestingly, whether or not schools are physically in or out of session may impact museums’ attendance seasonality. Traditionally, attendance increases over the summer when children are out of school and many people take vacations. If schools do not restart in person, it raises questions about whether families will be taking children to museums throughout the year – or not.
As of now, intentions to visit are depressed within the one-month duration – even beyond the dip we naturally see due to seasonality. This means that people are not necessarily planning a homeschooling rush on museums at the moment. However, as schools make their respective decisions about if, when, and how classes will commence in the fall, we may see early indicators of attendance that could buck the trend of traditional seasonality.
In sum, check back and we’ll keep you posted. When more schools have solidified their plans, it’s possible we will observe changes in intentions to visit.
Updated variance by region
In the charts below, we’ve shared data for many of the most populated geographic areas in the United States. In many cases, we’ve also grouped states together by both their geographic proximity and attitudinal similarity. For example, surveyed respondents in California, Oregon, and Washington indicate similar intentions to visit cultural entities; thus, they have been collectively aggregated and defined as a unique cohort. Where attitudinal variances have been observed within a region, this region has been accordingly segmented.
Here are intentions to visit by region at the end of July 2019 for comparative context. (Click on the charts to open a larger image.)
As you can see, some regions indicate different levels of intentions to visit even during a non-pandemic timeframe. This makes sense. Not every region has equal access and/or interest in cultural organizations. We frequently observe that regions with greater densities – both in terms of population and cultural enterprise – have higher near-term intentions to visit a cultural organization.
Here’s where things stood this last Saturday, July 25th, 2020:
As usual, let’s break this down…
Intentions to visit within one week by region
While regional one-week intentions to visit cultural organizations can provide signals to inform expectations, it’s the one-week intentions to visit your own organization that matter most. From a coronavirus-related perspective, this includes considerations unique to your organization type, local perceptions and tolerances related to COVID-19, your organization’s messaging during its closure, and your own audiences’ sensitivities to risk. Here’s a dive into what you should consider.
The chart below compares intentions to visit cultural organizations as of July 31, 2019, and this last Saturday, July 25, 2020. You’ll note that one-week intentions to visit have not recovered – even in the states that have started to reopen their cultural institutions. On the whole and even for individual regions, these numbers are low – especially in states most impacted by increased coronavirus cases.
States with increasing coronavirus cases tend to have the lowest intentions to visit cultural institutions. Interestingly, many of these are states that have reopened! Despite being open, intentions to visit in some states experiencing coronavirus surges are even lower than states that still remain largely closed, where visiting isn’t even possible for many institutions! This shines a powerful light on concerns surrounding the coronavirus and related visitor apprehension.
Among the areas monitored, intentions to visit within one week are highest within the DC, Maryland, and Virginia region. However, they are still significantly depressed compared to historic values.
Intentions to visit within one-month by region
Though much closer to historic values than one-week values, one-month intentions to visit still have not recovered for any region. In these charts, a difference of even one value is notable. When considering the second chart, remember one-month intentions to visit usually decrease slightly from a value of 18 at the end of June to a value of 17 by the end of July due to seasonality.
Coronavirus prevalence seems to be an important factor in these numbers, with those experiencing the biggest surges most negatively impacted.
Intentions to visit within three months by region
Now let’s look at three-month intentions to visit. People generally indicate intent to resume their more normal visitation patterns within three months from a national standpoint, with the caveat that we are able to evolve operations to make them feel safe. For individual regions, most are close, but some are not there yet. Still, these numbers are generally encouraging.
As the pandemic wears on without a reliable check on the virus, returning to historic visitation behaviors has represented a moving target. Those with interest in attending cultural organizations still intend to go, but they seem to be waiting until there is a stable condition in which to do so.
Regional one-week and one-month intentions to visit may be most important in the coming months as people determine how they feel most comfortable living alongside the virus. Similarly, intentions to visit cultural organizations may increase depending upon how schools decide to resume classes, potentially influencing these shorter-term metrics that are more grounded upon current conditions.
We’ll be back with more data on Wednesday as usual.
Be safe in the meantime – and please wear a mask.
Here are the COVID-19 data insights for cultural entities that we’ve published to date. Don’t want to miss an update? Subscribe here to get the most recent data and analysis in your inbox.