What is the benefit of trend analysis when it includes perceptions beyond your specific organization? Let me show you.
You’ve probably heard about some of the major trends impacting cultural organizations: the need to reach new audiences; the importance of digital connection; and the success (or lack thereof) of discounting to bring in new audiences, to name a few of many.
Some of these trends are staggeringly inconvenient for cultural executives and board members, and directly challenge “the way we do things” in the cultural sector. …But do these big data findings apply to your organization?
Market research trends center around the perceptions, behaviors, and motivators for engagement with cultural organizations. They are about people. They deserve careful consideration – and they matter. The benefit and importance of trend analysis is the subject of this month’s Fast Facts Video for Cultural Executives.
It’s important to note that not all research findings are created equal. IMPACTS will not even allow my colleagues and I to see data that has a confidence level less than 95%, and a majority of what we publish on this website has confidence levels above 97%. For context, 100% confidence means that every single person in the US is surveyed and the study is exactly repeatable. When we discuss the importance of trend data here, we mean high-confidence trend data from a large-scale, nationally representative study. This is a completely different beast than an Instagram poll of ones’ buddies or even a marketing agency asking a question to a few hundred people. We’re talking about the good stuff!
Here are three reasons why observing broader trends is critical for understanding audiences and informing the direction of individual organizations.
1) Trends provide a birds-eye view of perceptions and behaviors of current and potential audiences
Trends can allow your organization to peer into the minds of current and potential audiences, making your organization aware of challenges and opportunities.
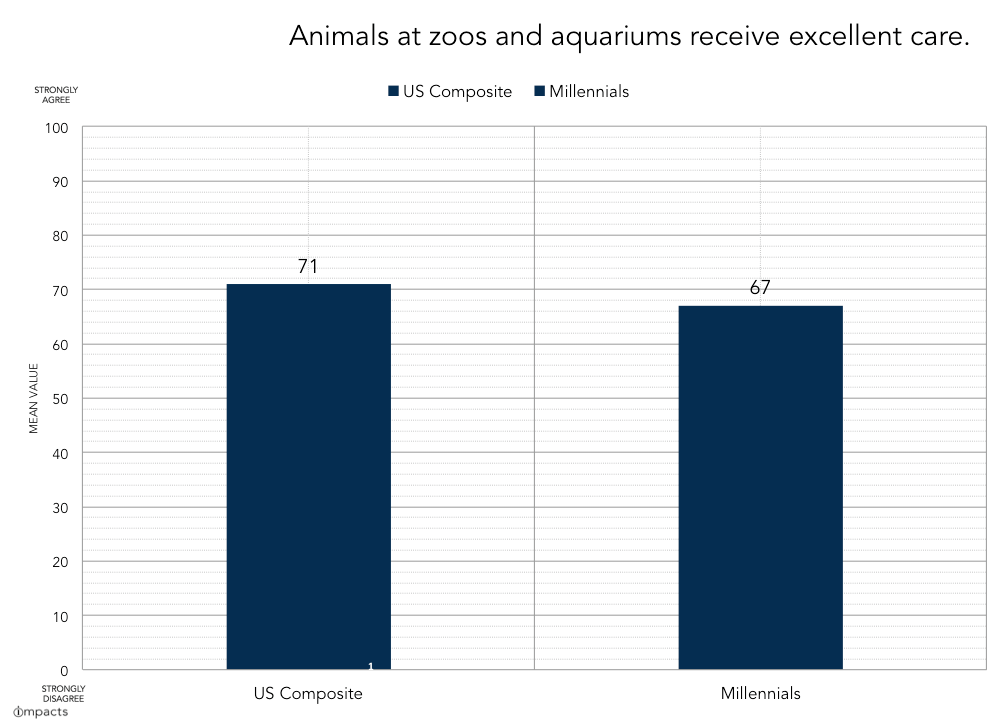
Let’s zoom in on some trend data for zoos and aquariums to help illustrate the point. Research shows that millennials are less likely than overall audiences to believe that animals at zoos and aquariums receive excellent care. As usual, this data comes from the National Awareness, Attitudes, and Usage Study. The data is measured in scalar variables from 1-100, which allow for more accurate measurements based on the type and size of information we collect. Even slight differences in the numbers are statistically significant, which means the delta between 67 for millennials and 71 for the US composite is very notable. In fact, it’s rather alarming for zoos and aquariums.
Whether a leader feels that these perceptions are impacting their specific organization or not, the general perceptions held by national audiences can inform the development of successful programs.
Think of it this way: It’s helpful to know if there’s a tornado warning in the area, even if you aren’t sure if it’s rolling down your, specific street. Just knowing with confidence that there’s a tornado in your midst can help you decide how to prepare and respond. Or a sharknado, if you’re a zoo or aquarium!
(I just had to...)
2) Trends help determine where to direct additional data collection efforts for your own institution
Let’s follow this example and take a look at this finding in another way. This chart shows how much people believe that animals at specific zoos and aquariums receive excellent care. The letters on the x-axis represent individual zoos and aquariums (A, B, C…).
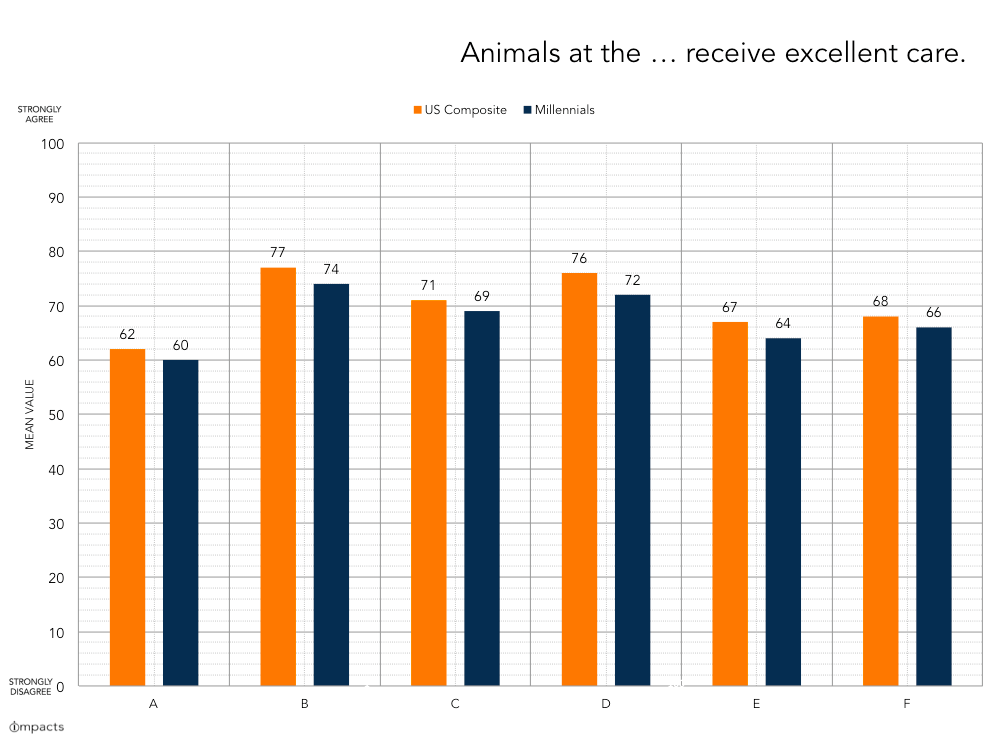
Some organizations are indeed perceived as providing better care than others! Scalar variables in the high-70s – such as those secured by organizations B and D – are very high! (“I love my mother” has a national mean value of 76.). Organization A has values in the low 60s, indicating active disagreement with the statement. Given the sensitivity of these metrics, there is a great deal of variance in the public perception of these organizations… and that makes sense! Not all aquariums (for instance) are “good actors.”
As executives within the sector may intuitively understand, cultural organization “types” share a great deal of similarities, but are not necessarily perceived to be the same. This is often the basis for a common, poisonous defense in the face of difficult data: “That doesn’t apply to me.”
But look at the data again. Do you notice anything else interesting?
In all instances above, millennials report lower levels of agreement with the statement. (IMPACTS tracks many zoos and aquariums, and we observe this delta in nearly all of them.) Even market leaders – such as organizations B and D – are not immune to the trend! Millennials may believe that these organizations provide excellent care to their animals, but it is still at a lower level than the US composite. It may not matter if your organization is Entity A, B, C, D, E, or F. If you’re a zoo or aquarium, knowing that millennials have this perception should inform your strategic direction.
Shining a light on trends can help cultural organizations figure out where to direct their own data collection efforts. Collecting their own information helps an entity determine the extent to which a trend applies to them. It is only after collecting their own insight that an organization may have confidence that they are, in fact, an exception to the trend.
3) Trend data helps organizations meet audiences where they are
Trends are about people and behavior. Cultural organizations are also about people and behavior. After all, most of them aim to educate and inspire. Understanding the broader behaviors and motivations of all people – and not just the people who have chosen to attend your specific, special Sharknado cocktail hour on a Tuesday night – can help inform strategic direction to engage new audiences. Audience research and evaluation are very important, but market research is necessary in order to understand who is not coming through an organization’s doors.
Even though organizations are individual entities with different programs and different markets, we’ve found that mission-driven, visitor-serving organizations share a great deal of similarities in the kind of people that they attract, and how they influence human behavior.
Trend data can help us understand how people make decisions in our noisy, connected world… as well as how demographics are changing, where folks are directing their attention, and how to “meet audiences where they are.” Meeting audiences where they are means making sure that our programs, experiences, and offerings are developed, promoted, and executed in a way that is relevant to them. It helps us “meet them” where and how they want to be met in order best educate them, inspire them, or motivate them to come through our doors in the first place.
In sum, high-confidence trend data provides critical insight for the development of long-term strategies, helps determine avenues for further exploration, and it is critical for understanding audiences. While it may be entirely human to distance ourselves from difficult findings that require a great deal of hard work to overcome, we encourage leaders not to see findings and angrily and blindly declare that it doesn’t apply to them, based upon their feelings.
After all, a primary benefit of data isn’t that it allows us to look backwards and congratulate ourselves on past decisions (although it’s nice when it does), but that it removes guesswork and informs our direction moving forward.
Instead of declaring that trends do not apply to or impact them, we encourage leaders to ask, “To what extent do these realities apply to us, what do we need to know about our own institution given this critical information, and what is the best way forward?”
Nerd out with us every other Wednesday! Subscribe here to get the most recent data and analysis on cultural organizations in your inbox.